Closer look at the Altimetric Datasets
Published:
Let’s take a look at different datasets with help of some Visualizations. The two datasets used are -
- AVISO GDR
- ALES OpenADB coastal retracked from Technical University of Munich (TUM)
These are nothing new or noval ways to visualize. This might even seem very trivial to many, but this is my effort to document my learnings and develop as a researcher.
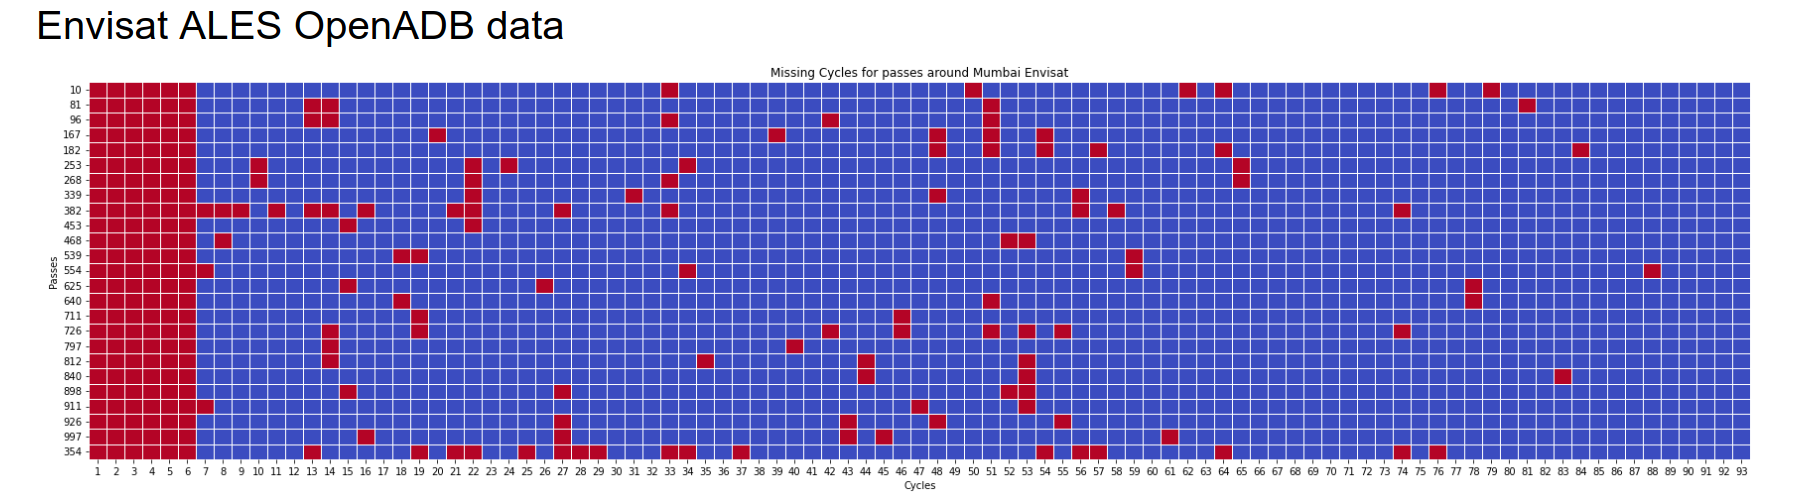
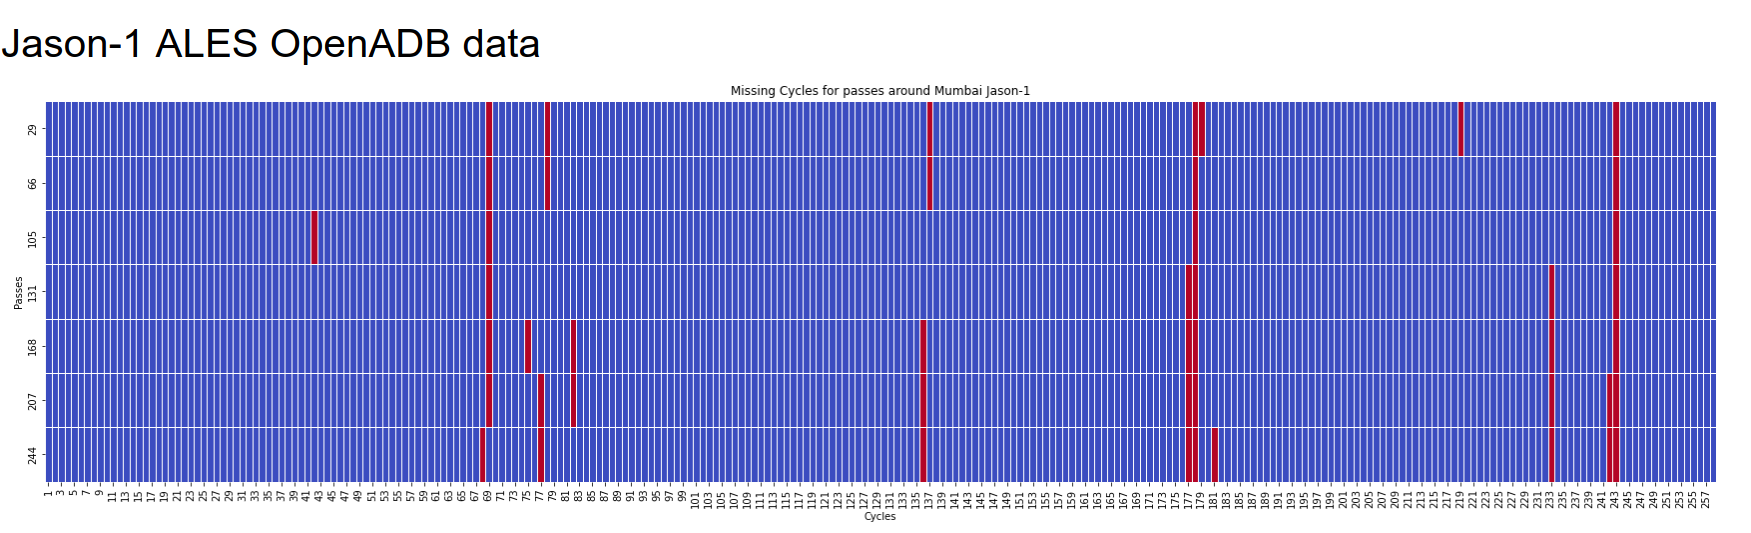
1. Data Availability (Missing Cycles) across cycles and tracks
The red represents missing cycles whereas blue represents data availability.
SARAL ALES OpenADB data 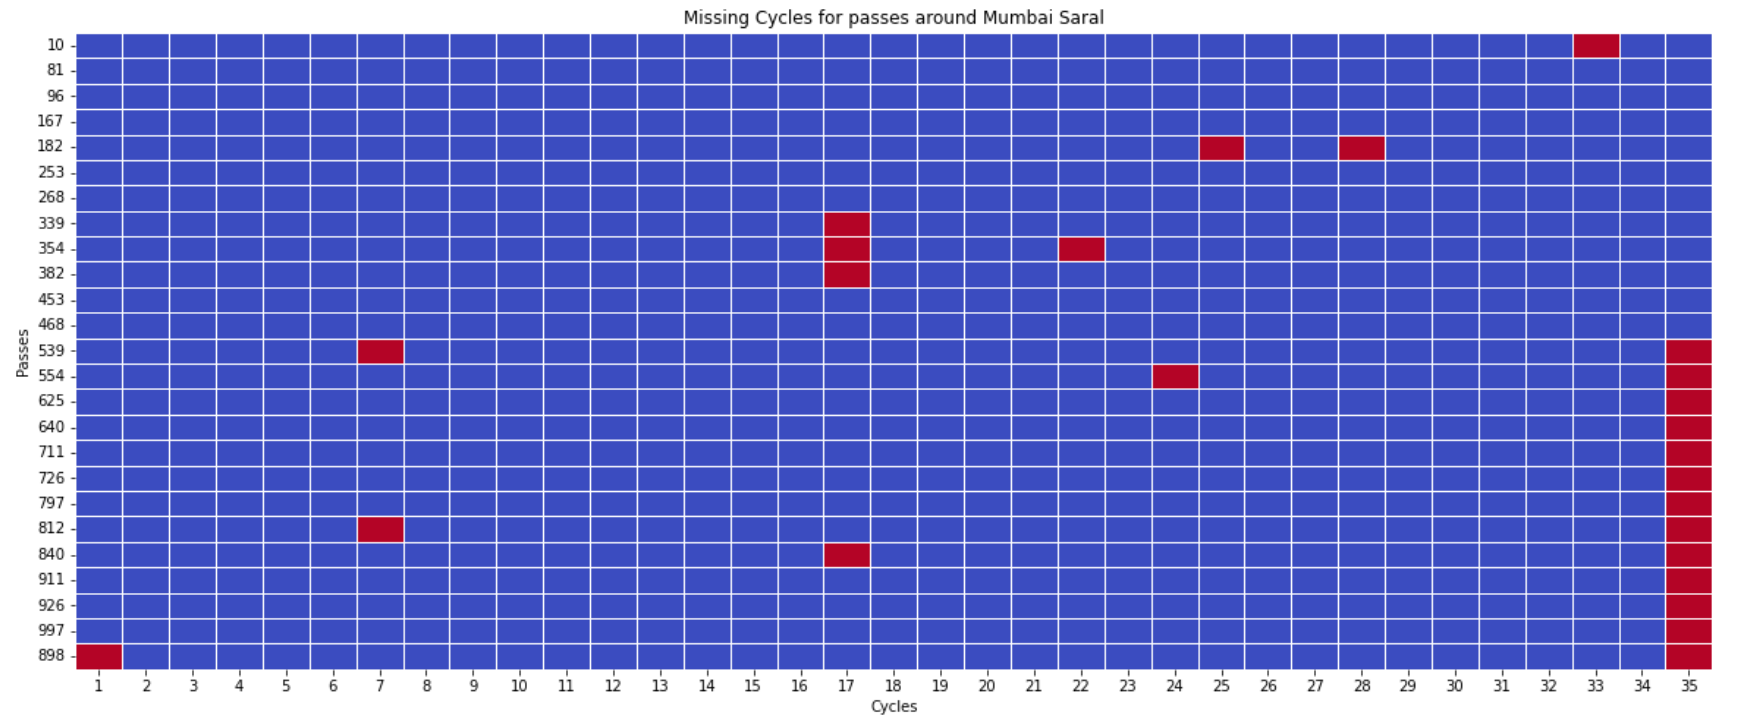
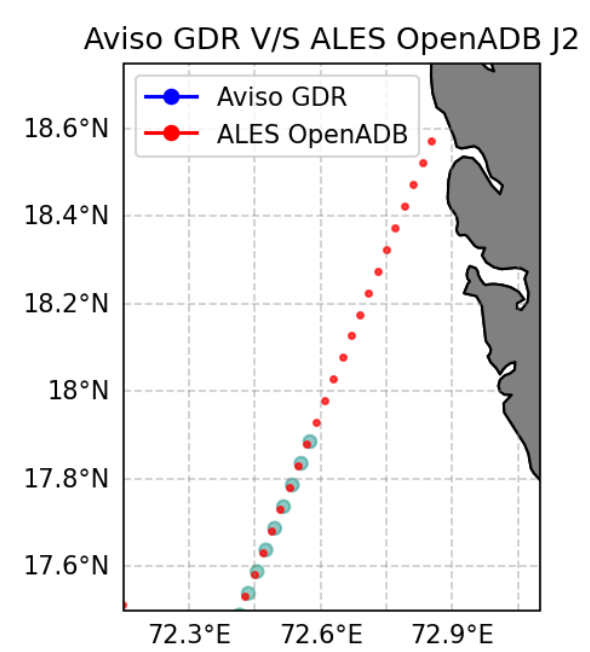
2. Waveform contamination and distance to coast
The waveforms were retrieved from the Sensor record from AVISO.

In the standard AVISO GDR data processing the coastal regions are masked. Whereas the Sea Surface Height (SSH) info can be retrieved to certain extent using coastal retracking algorithms. Precisely can be observed in the ALES OpenADB data.
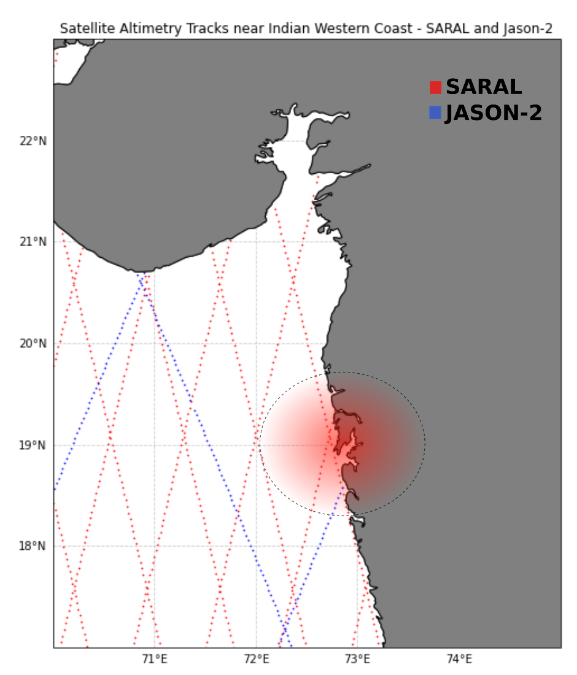
3. Spatial and Temporal resolution tradeoff
The tracks of SARAL are more closely spaced compared to the Jason-2 tracks. SARAL has a repeat cycle of ~35 days whereas Jason-2 has of ~11 days.
4. Repeat Passes
The repeat passes do not allign exactly, which is expected due to orbital peturbations and other practical limitaion involved with satellite geodesy.
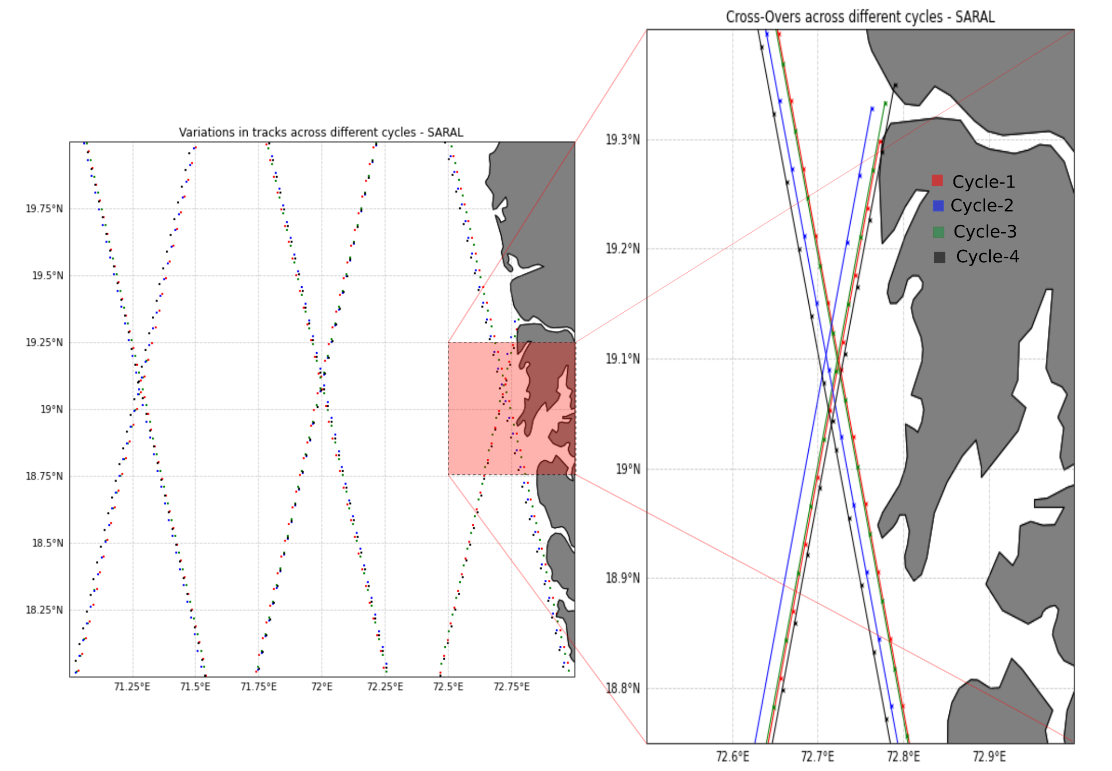
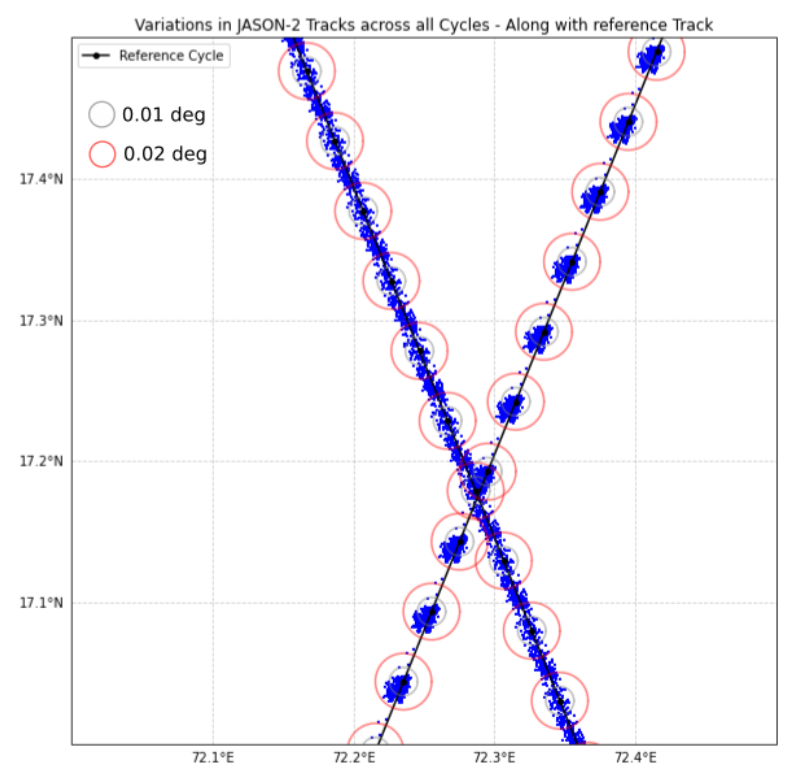
5. Closer look at the repeat passes
SARAL mission has pretty scattered accquisation points, scattered both along the accending and descending tracks.
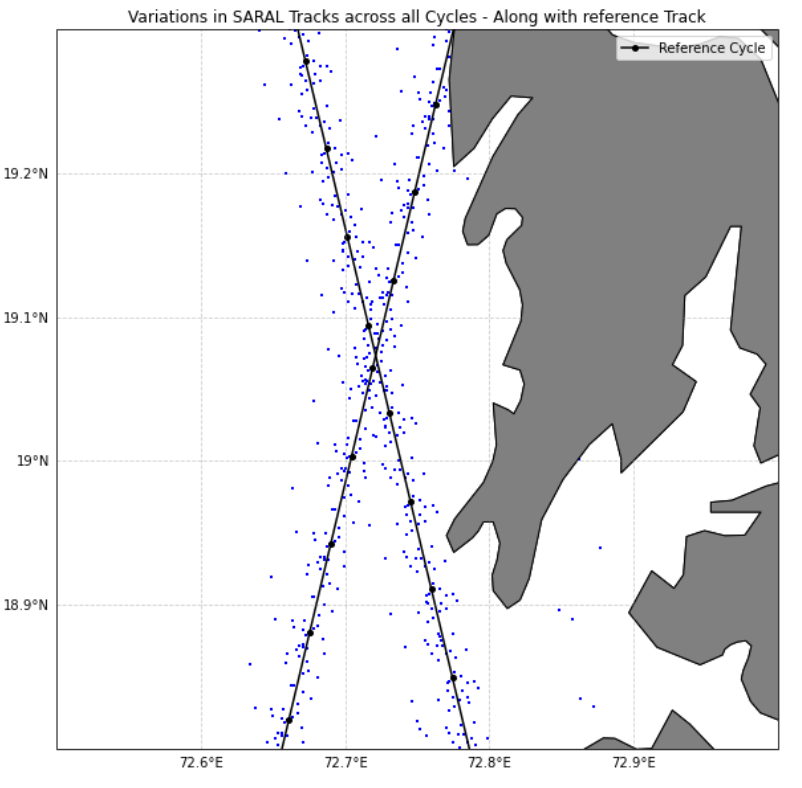
Curiously, for Jason-2 the accqisations are pretty well clustered along descending track and not so well along the ascending track. I could not find any references which explained this observations.
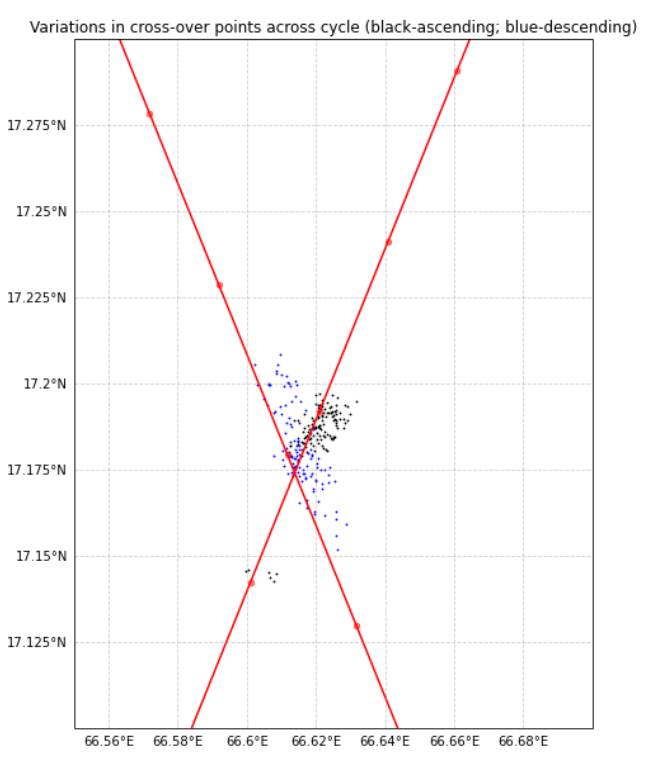
6. Let’s find the Cross-Over points
The cross-over was identified by determining the minimum distance b/w pairs of ascending and descending track accquisations over a small window.
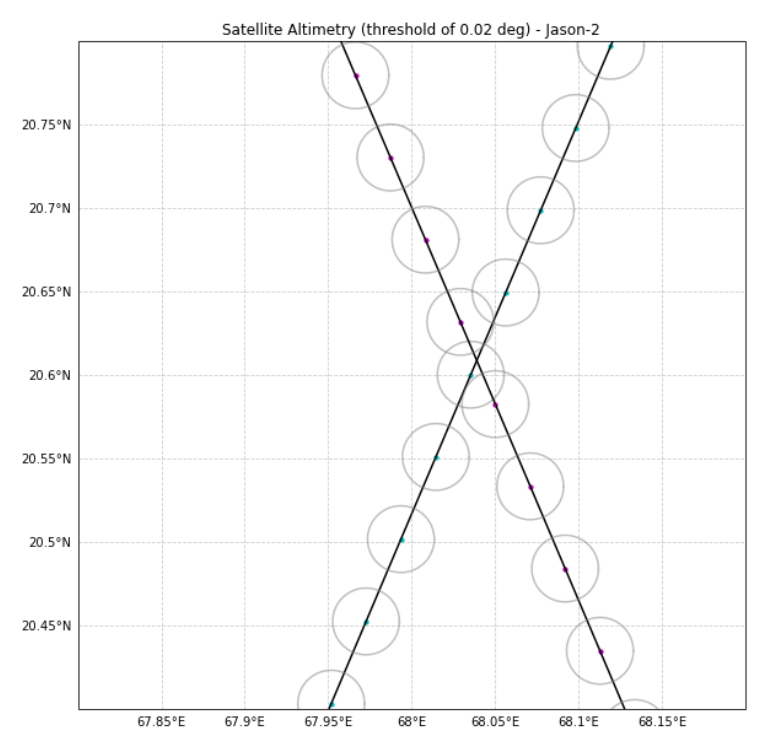
The traingle represent the two cross-over points, not exactly coinciding with each other.
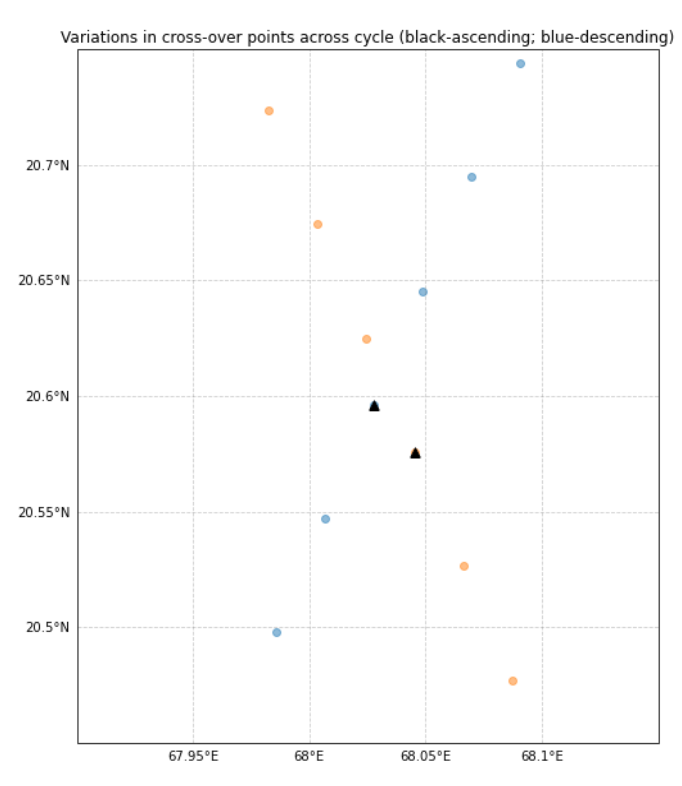
Following the same approach for other cycles we get the following variations in cross-over points.